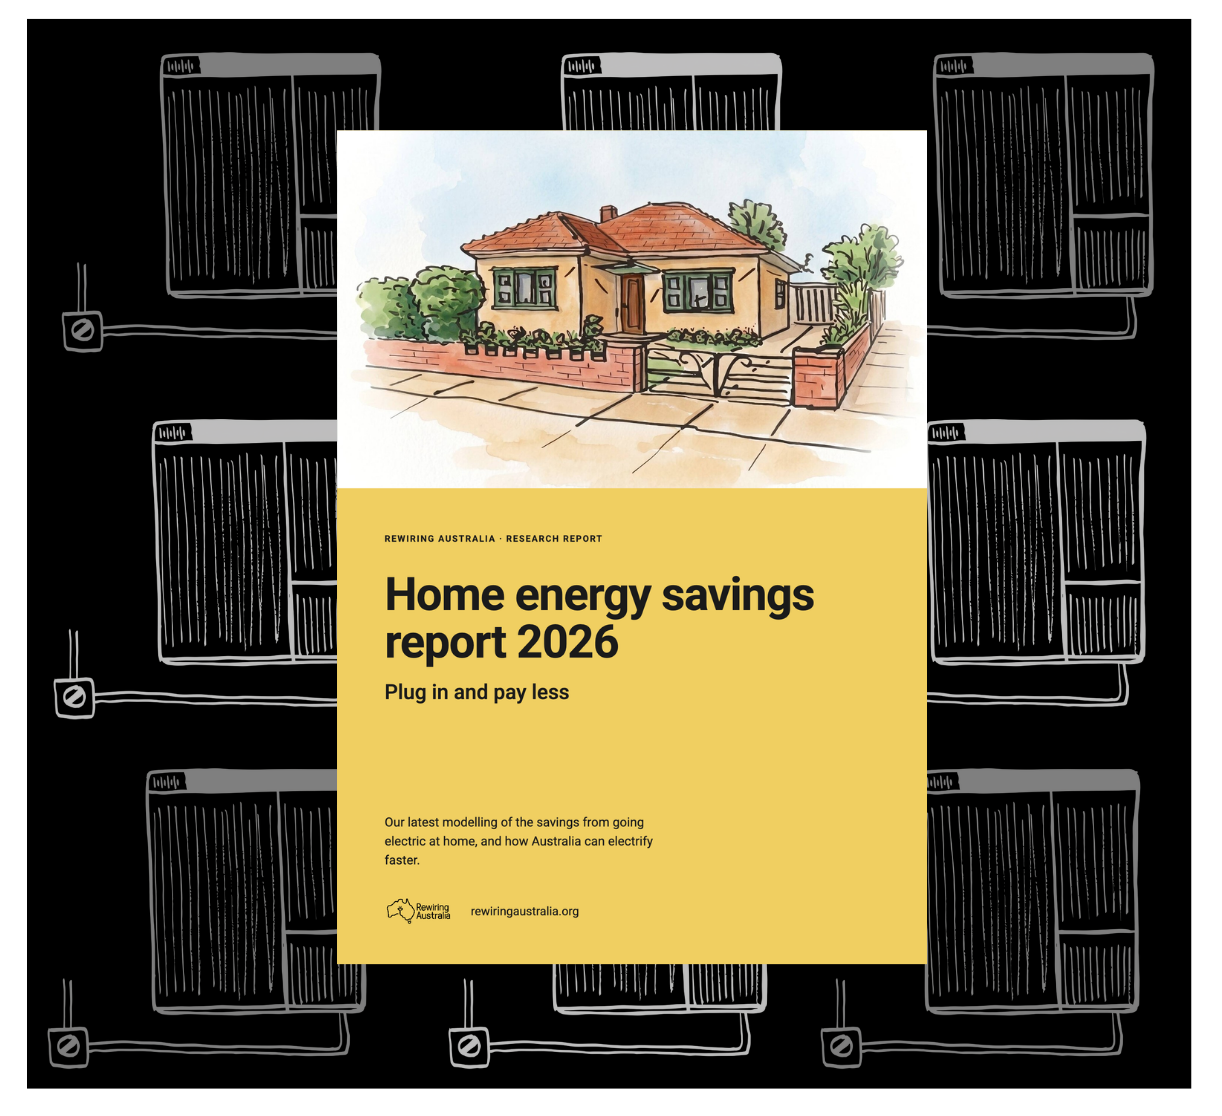
Home energy savings report: Plug in and pay less
What going electric saves an average Australian household
a year from swapping gas and petrol appliances for electric, with no solar
a year once you add rooftop solar and a battery
savings for an average apartment household (with solar)
All including upfront costs

Key insights
Cheaper to drive
Upgrading to an EV from petrol saves around $2,000 a year in running costs.
Where the savings come from
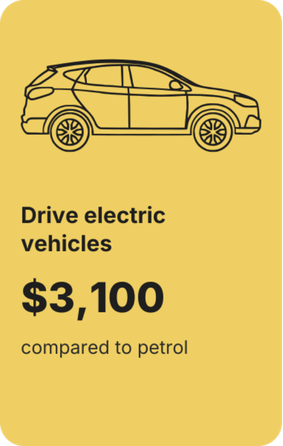
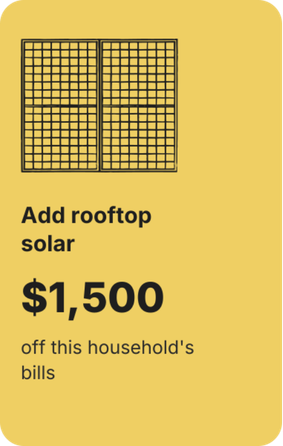
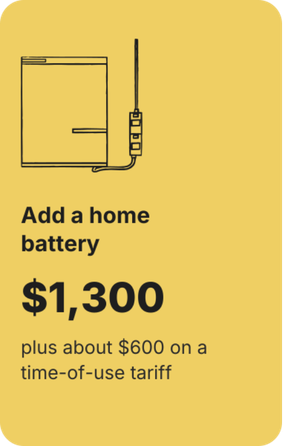
Driving an EV is the single biggest saving at $3,100 a year *, ahead of solar at $1,500 and a battery at $1,300.
* av household (1.88 vehicles)
Apartments too
An average apartment household can save $1,800 a year by going all-electric.
World leading
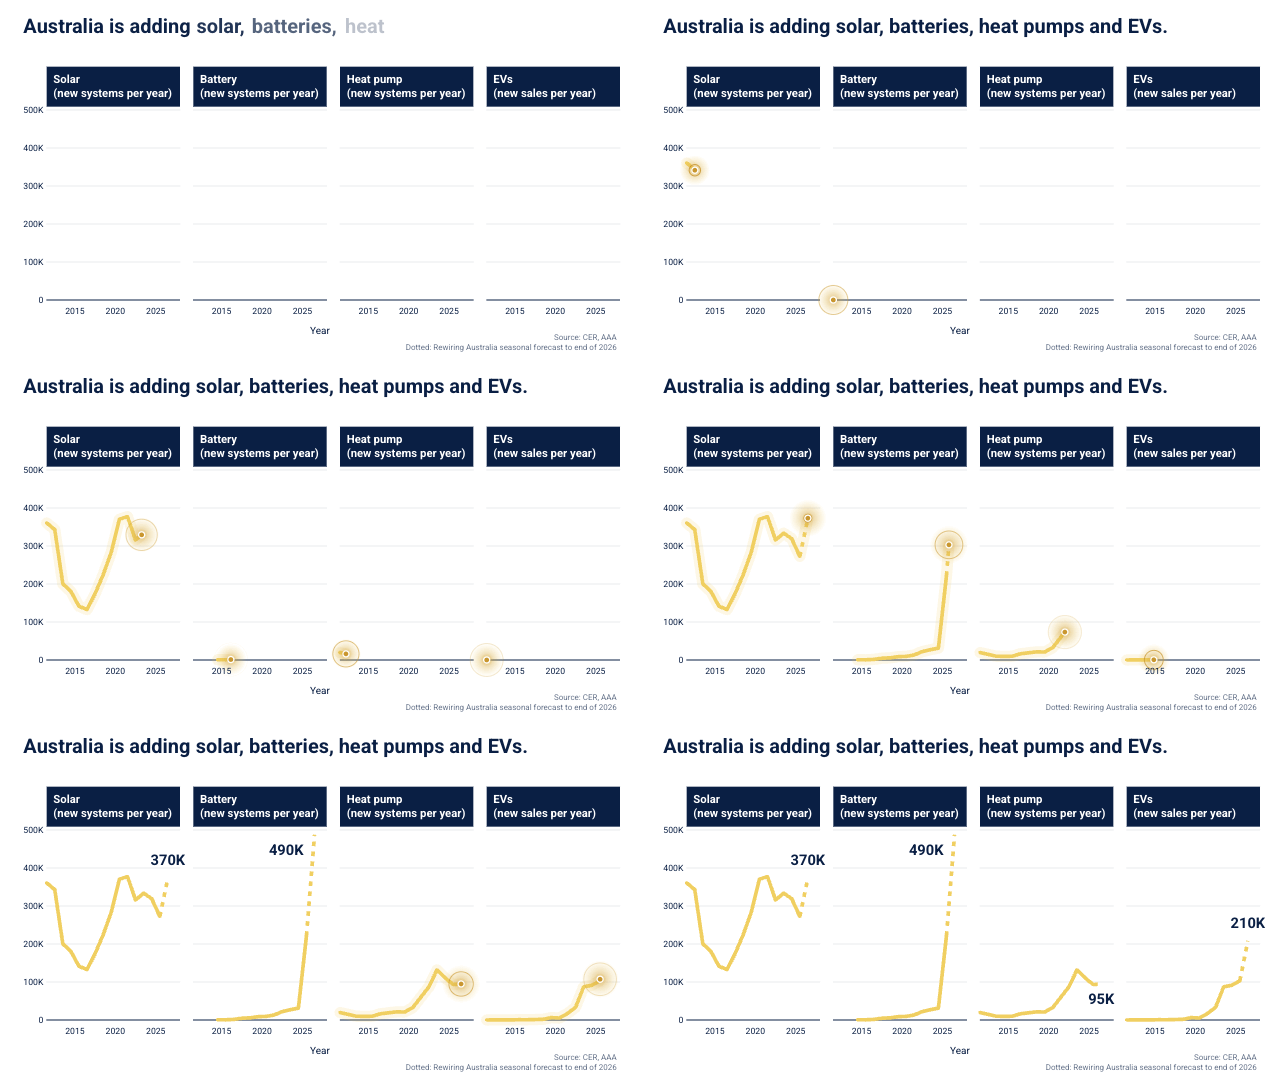
Australia led the world on home battery installations this year, passing the capacity the market operator forecast for 2028.
Plug in and pay less
Australians are going electric: rooftop solar, batteries, electric vehicles (EVs), and hot water heat pumps. In 2026, home batteries and EVs have surged in popularity. Households are leading the way to a future Australia with cheaper energy, higher comfort and cleaner air.
Going all-electric at home (hot water, heating, cooking and EVs) will save $3,000 on average and adding solar and a battery increases the savings to $4,300.
Our analysis shows that an average driver can expect to save $1,700-$2,200 every year from switching to electric. The EV revolution has arrived with a wave of new, cheaper models, nearly a third of new cars are now electric, and the second-hand market is growing every year.
2026 is also the year of the home battery, Australian homes already have more battery capacity than was expected in 2028.


About this research
Report downloads
Related readings
Plug in and pay less
How the electrotech revolution is accelerating
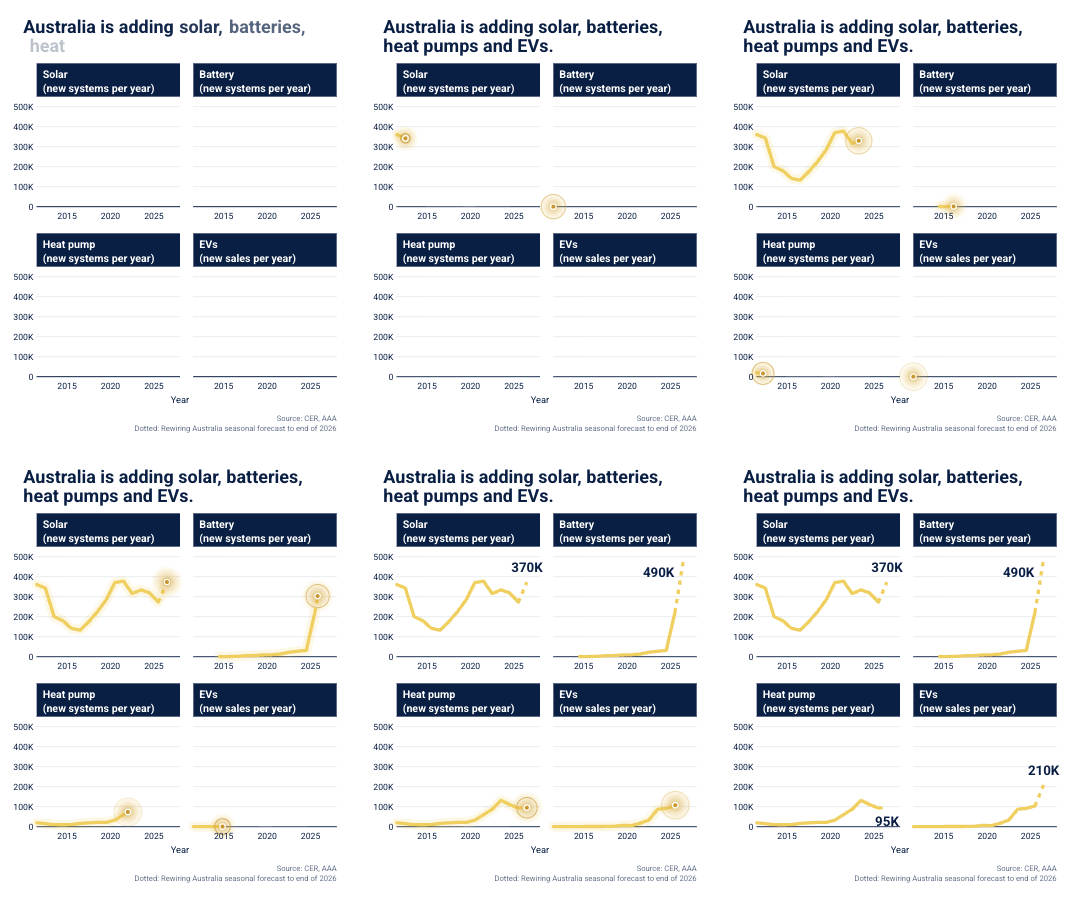
The big switch to electric is accelerating across Australia. There is rooftop solar on four out of every ten homes across the country; in some states half of homes already run on solar. Every year, tens of thousands of homes install a heat pump which can use solar power to efficiently heat hot water. Since July 2025, more than 500,000 households have installed a home battery; people are adopting batteries even faster than they did solar. Then the fuel supply shock in March 2026 has triggered a deep change in the car market as households have bought up electric vehicles (EVs) to replace their petrol cars faster than they can be imported. In July and August 2026, battery-only EVs (i.e. excluding hybrids) eclipsed both petrol and diesel to become the best-selling fuel-type in Australia for the first time.
The destination is clear: Australia will be a competitive, electric nation running efficient electric appliances powered by secure, local solar, wind and batteries. This future electric Australia will enjoy the same level of comfort and convenience, with lower bills, greater autonomy and enhanced economic and energy security. What we can still decide is how much money Australia will burn on fossil fuels along the way. Heat pumps, batteries and EVs are still at an early stage of adoption, the faster they dominate the mainstream market, the sooner the benefits and savings will be felt.
The faster we electrify, the more we save.
How much can an average household save?
For Australian households, going electric saves money. Running on electricity leads to dramatically lower energy bills overall: your electricity bill may go up, but the elimination of the gas and petrol spending will nearly halve your cost.
Switching your hot water, heating, cooking and car to electric cuts the average household’s energy bills by $4,600 a year. Add solar and a battery and your bills fall by $8,000.
Even after paying for the upgrades, households come out $3,000 to $4,300 a year ahead.
How big are the savings when you include upfront costs?
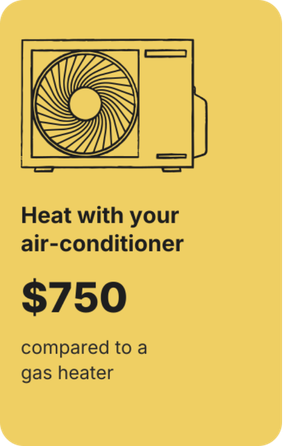
For Australian homes, switching from petrol and gas to electric will save money. In an average house, upgrading your appliances, without installing rooftop solar or a battery, can bring average savings of $3,000 a year. This household spends a little more upfront on a heat pump and electric vehicle but spends less than half as much each year on running costs.
If you add rooftop solar and a battery, the average all-electric Australian household can save $4,300.
When we consider the upfront costs for the new appliances and vehicles, the benefits are offset by the upfront cost, but households still save thousands of dollars a year. Our research suggests that efficient electric versions are still a little more expensive than their gas or petrol counterparts. Our analysis includes the upfront cost as well as 6% interest. In an average house, upgrading your appliances, without installing rooftop solar or a battery, can bring average savings of $3,000 a year. This household spends a little more upfront on a heat pump and EV but spends half as much each year on running costs.
And if you include solar and a battery?
If you add rooftop solar and a battery, these savings jump up to $4,300 a year. Adding a battery enables the household to make good use of a time-of-use tariff - where electricity prices vary depending on the time of day - which helps to lower bills.
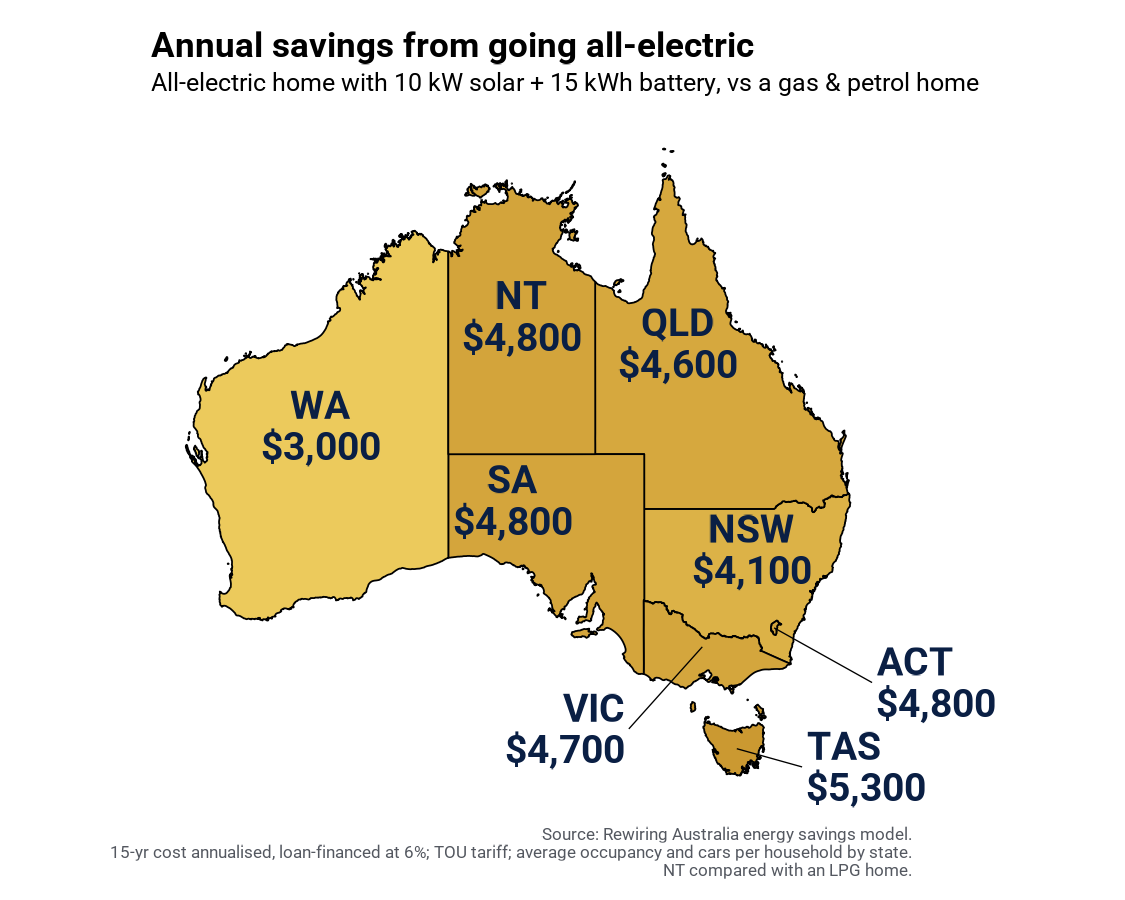
Efficient electric is cheaper in every state
The average savings vary across the country depending on the cost of electricity and gas and other local factors, but in every state going electric will save households money. The savings vary for a number of reasons. Down south in Tasmania, Victoria and the ACT, the high heating demand through cold winters increase energy use and savings. South Australia has high electricity and gas costs and so rooftop solar and electrification save more money. Lower gas prices in Western Australia reduce the savings compared to other states. In the Northern Territory and Queensland, higher driving distances increase the benefits of going electric; plus in the Northern Territory there is almost no reticulated gas, so the comparison here is between electric and bottled LPG (which is more expensive than mains gas) which contributes to higher savings.
How much can apartment residents save?
Going electric will save money for those living in both houses and apartments. Apartments tend to use less energy than freestanding houses, these energy savings are mainly in space heating and cooling because apartments tend to have fewer external walls. Our modelling shows that apartments stand to save $1,800 a year from upgrading to electric.
Renters are falling behind
Just 12% of Australia’s 3 million rented properties are reported to have rooftop solar, compared to 44% of owner-occupied homes. This is due to the well-documented ‘split incentive’: landlords have the power to install solar and upgrade appliances, but little incentive, as the bill savings accrue to the residents. As a result, renters face higher energy bills than homeowners and have far fewer options to reduce their energy usage through upgrading to more efficient appliances. Rented properties now make up nearly half (44%) of all occupied homes without solar. Ensuring access to the benefits of renewable energy and electrification for renters is now the largest part of the challenge.
The EV revolution is here
Australian cities remain among the most car-dependent in the world: many people are obliged to own and use a car to get to work and do the shopping. Our freight transport is also extremely road-dependent and Australia is a big place. As a result, we consume around 2,200 litres of oil per person each year, among the highest in the world outside of major oil producers, including more diesel per capita than any other country. As a major oil importer, Australia stands to gain enormously from the adoption of EVs both financially and in energy security terms.
Australian households alone spend more than $24 billion on petrol and diesel every year. When you include business and industry, Australia paid more than $35 billion for petrol and diesel imports. This money disappears offshore and is a huge drain on our economy. At the same time, we generate more than 10,000 GWh of excess electricity from our rooftops every year, which currently just runs out into the grid, enough to run more than 4 million EVs.
Australia has led the world on solar and batteries are taking off, but we are behind on EVs. We have the electric fuel, we just need the vehicles. As fuel prices have rocketed in 2026, Australians have taken up EVs faster than ever - one in four new cars sold in August and September was electric.
How expensive is petrol for households?
Transport is by far the biggest slice of household energy spending in Australia. With petrol at $1.80/L, the average Australian household spends $5,800 every year on petrol running around 2 cars. By upgrading to EVs, the same average household could save more than $2,600 each year.
Why do EVs save so much money for households?
Running on petrol costs many times more than electricity. An EV charged from your rooftop solar can drive 100km for just $1, compared to spending $20 for the same journey on petrol. Even without solar, most EV owners are now on an EV electricity tariff meaning that they can do that 100km drive for just $1.50.
How much will an EV save on petrol?
The running costs of an EV save around $2,000 a year across different vehicle types. This variation is due to the efficiency of the different petrol and electric models.
How much can an EV save overall, when you include upfront costs?
When you add in the upfront cost of buying the car, it is still significantly cheaper to buy and run an EV than an average new petrol car. However, the savings depend on the price of the car. Specifically, they depend on the difference in price between the EV and the alternative petrol car - where the EV costs significantly more than the petrol version the overall savings are lower. Some small EVs, like BYD’s Atto 1 and Dolphin, have recently reached the same price as equivalent petrol models, meaning that for these models you save money from the moment you start driving. We modelled the savings for hatchbacks, sedans and SUVs to explore the differences - in general, the SUVs were around $13,000 more than their petrol counterparts, sedans were $17,000 more, whilst the hatchbacks were pretty much the same price. Electric sedans and SUVs are still cheaper to own, but the savings are lower than for hatchbacks due to their higher upfront cost.
The year of the home battery
Home batteries enable us to cheaply and efficiently store solar energy to use later in the day. The Federal government’s Cheaper Home Batteries program has mobilised a rapid rollout of batteries into more than 500,000 homes since July 2025. As a result, Australian households’ enthusiasm for home batteries has surpassed the market operator’s forecasts: we already have more home battery capacity than was forecast for 2028.
Read the full report:
“Every day, about 3,000 Australians replace a gas appliance in their home. Another 3,500 buy a new car. In order to lower energy bills, cut dependence on fossil fuels and help the planet, people should be choosing an electric replacement. We’re already seeing communities across the country lead the way on electric upgrades, but governments need to be delivering the plans and policies that will get that done for everyone,”
Rewiring Australia CEO Francis Vierboom said.
How we electrify faster and fairer
To cut the cost of living and deliver Australia's legislated emissions reductions, every residential gas appliance needs replacing by 2040. Across the country that means, every week on average for fourteen years:
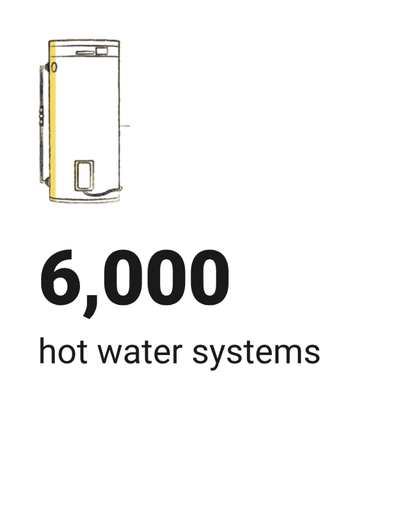
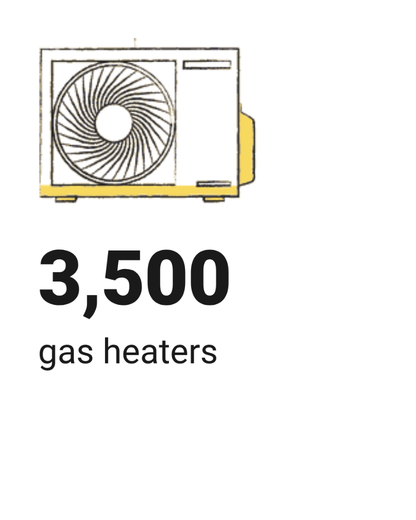
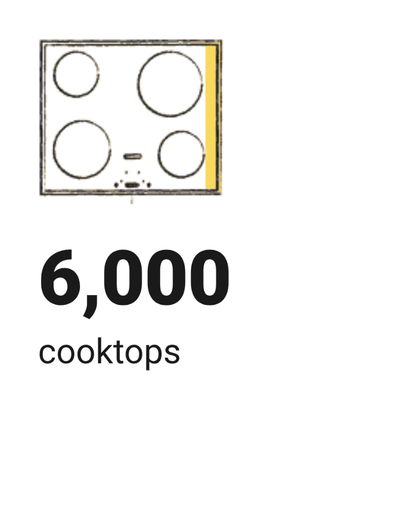
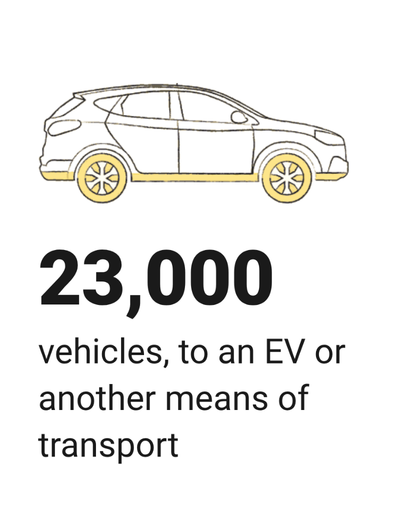
Number of replacements every week on average for fourteen years.
How we electrify faster and fairer
1
Even faster electrification
2
National alignment and coordination
3
Flexible finance
4
Support for apartments and renters
The report in the media
National mastheads, television and ABC local radio covered the report's finding that households can save $4,300 on their energy bills by going electric but not everyone is reaping the benefits.



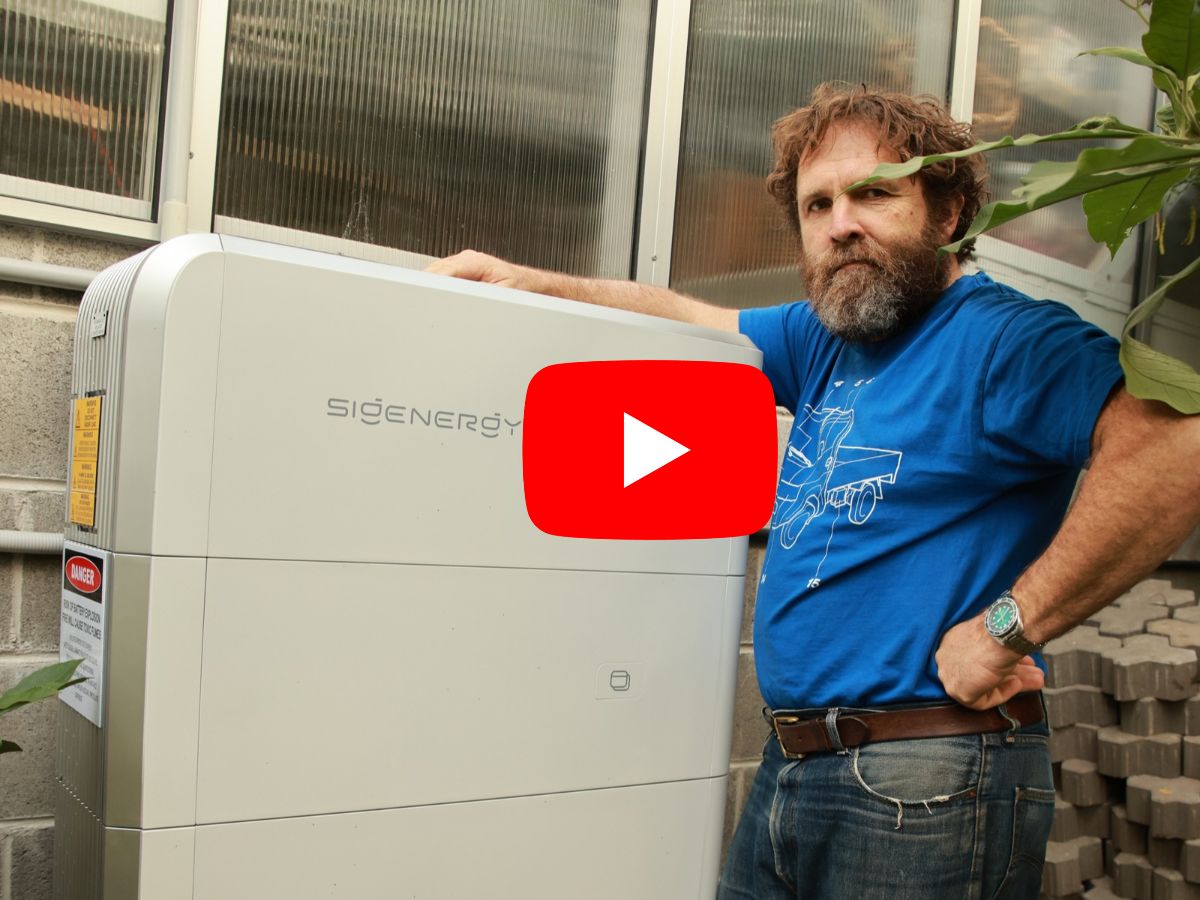
Saul Griffith on what the report found
Households can save $4300 a year on their energy bills by ditching gas and petrol and going fully electric reveals Dr Saul Griffith.
But we need to do a better job to make sure that renters and low income households have access to the savings from this energy transition.